

sanal mağaza
Randevu
etkinlikler
Pop-up

Analytica Business Analytics
Sunan:
Sales, customers and products in one view
Henüz değerlendirme yok
14 gün ücretsiz deneme

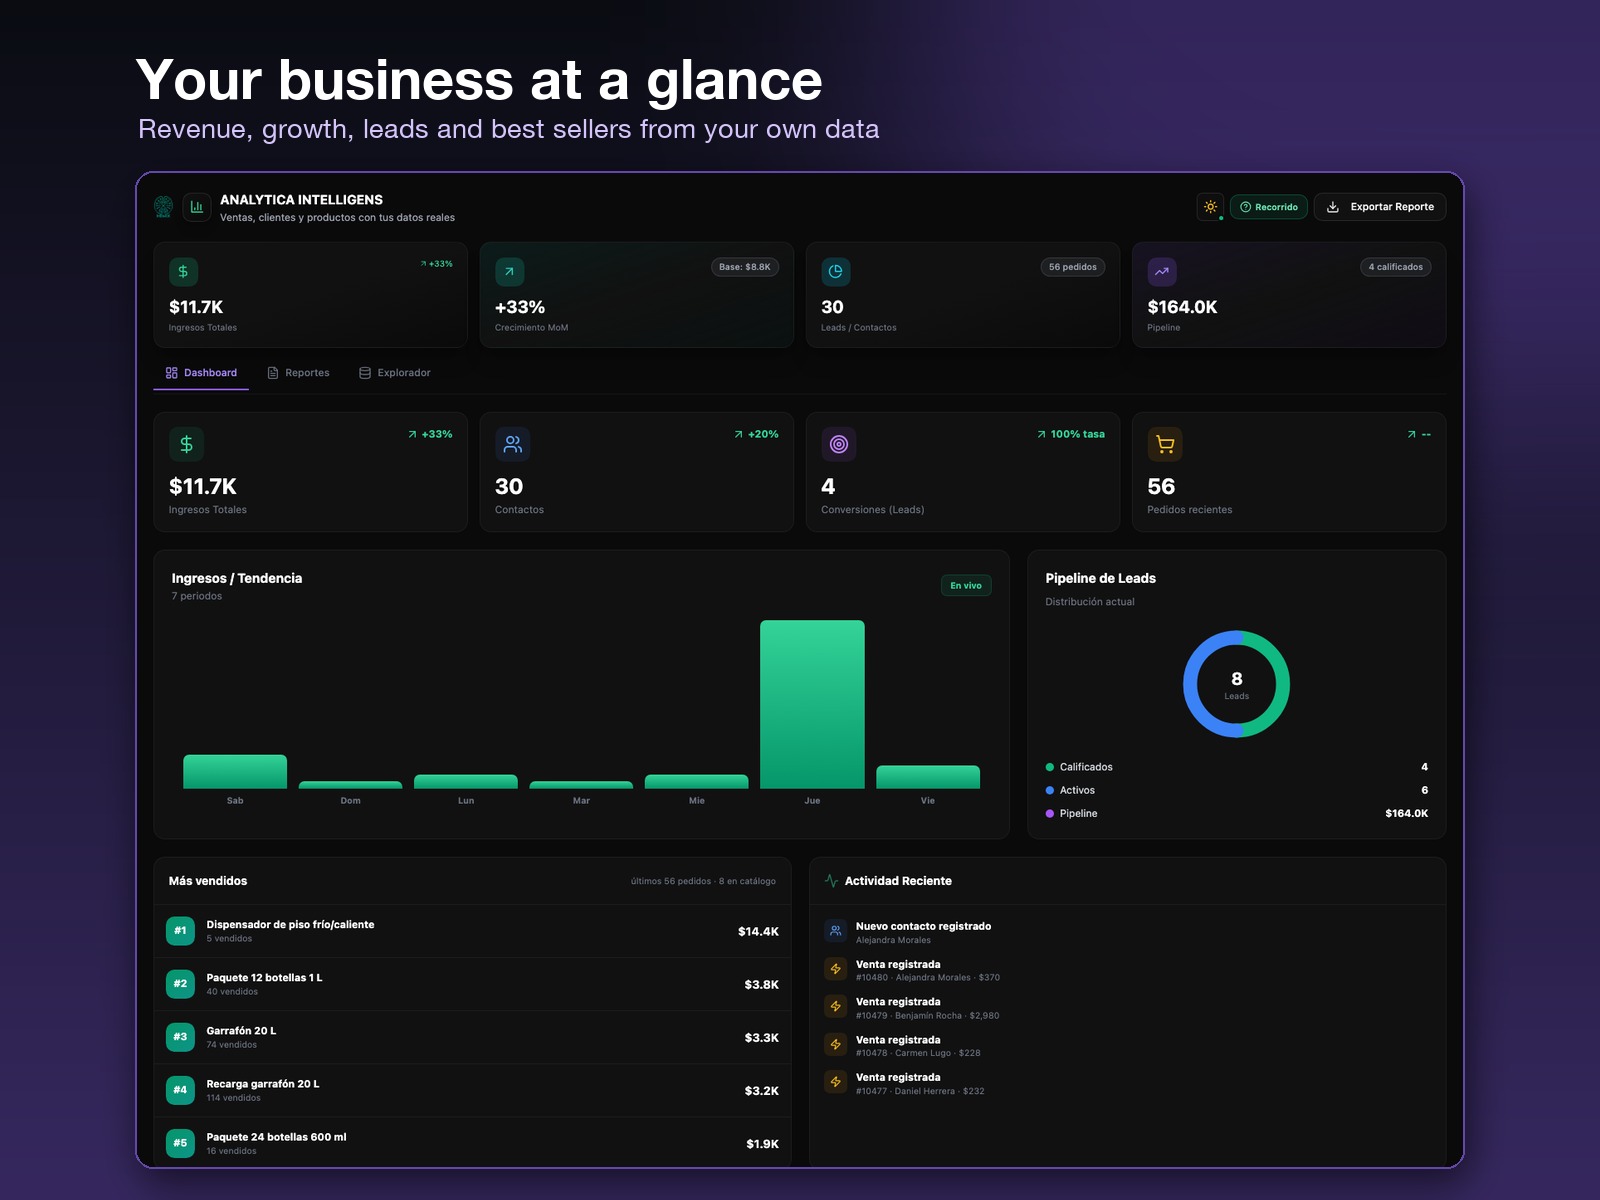
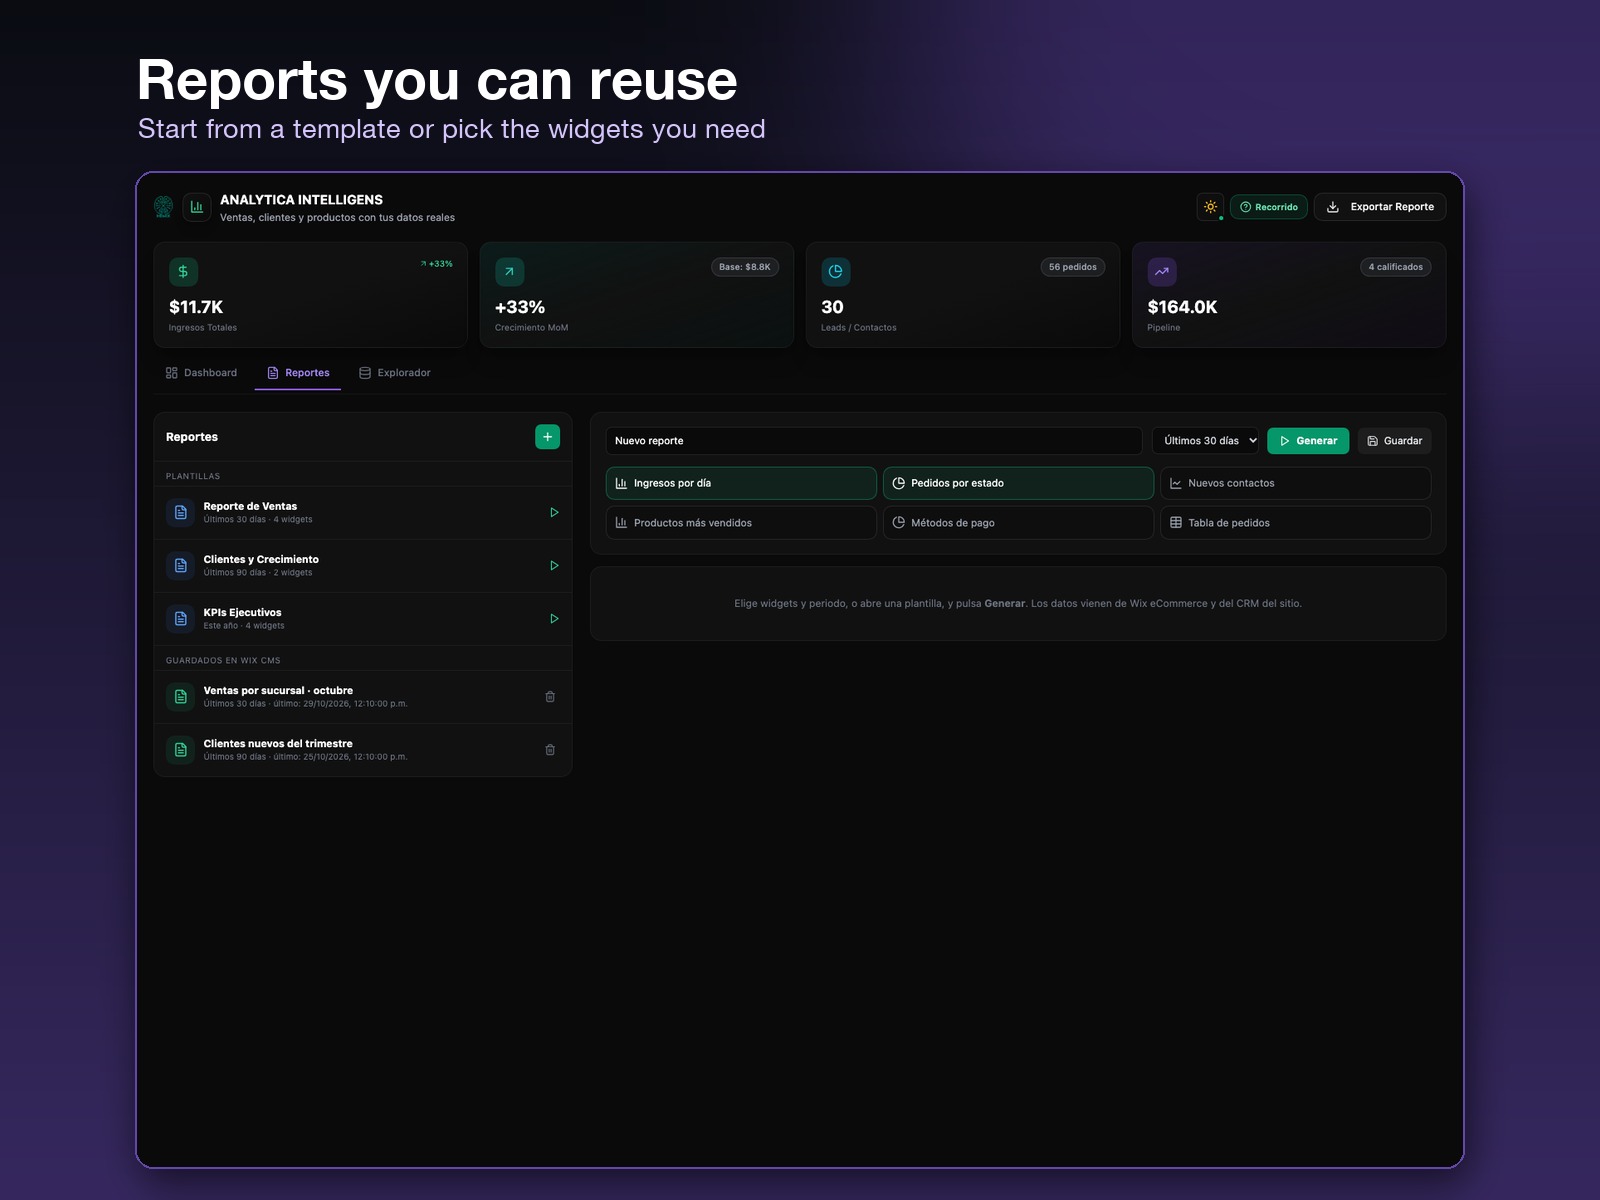
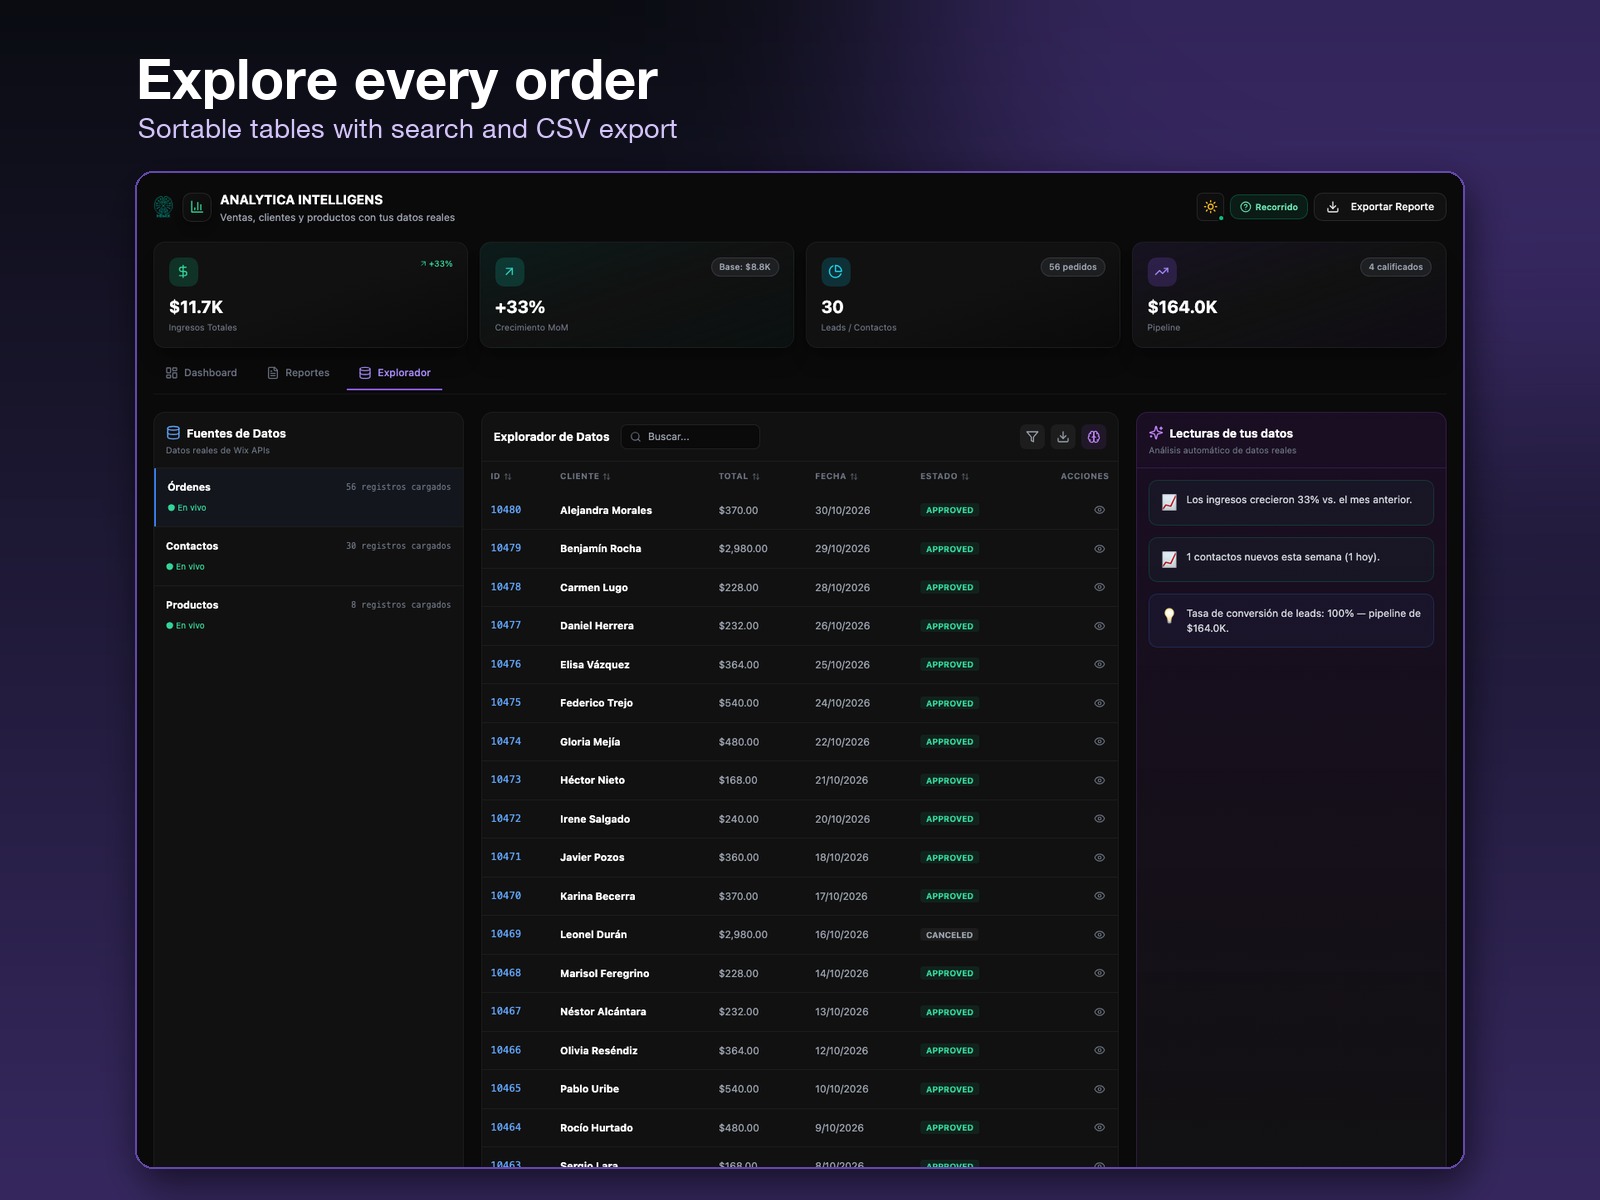
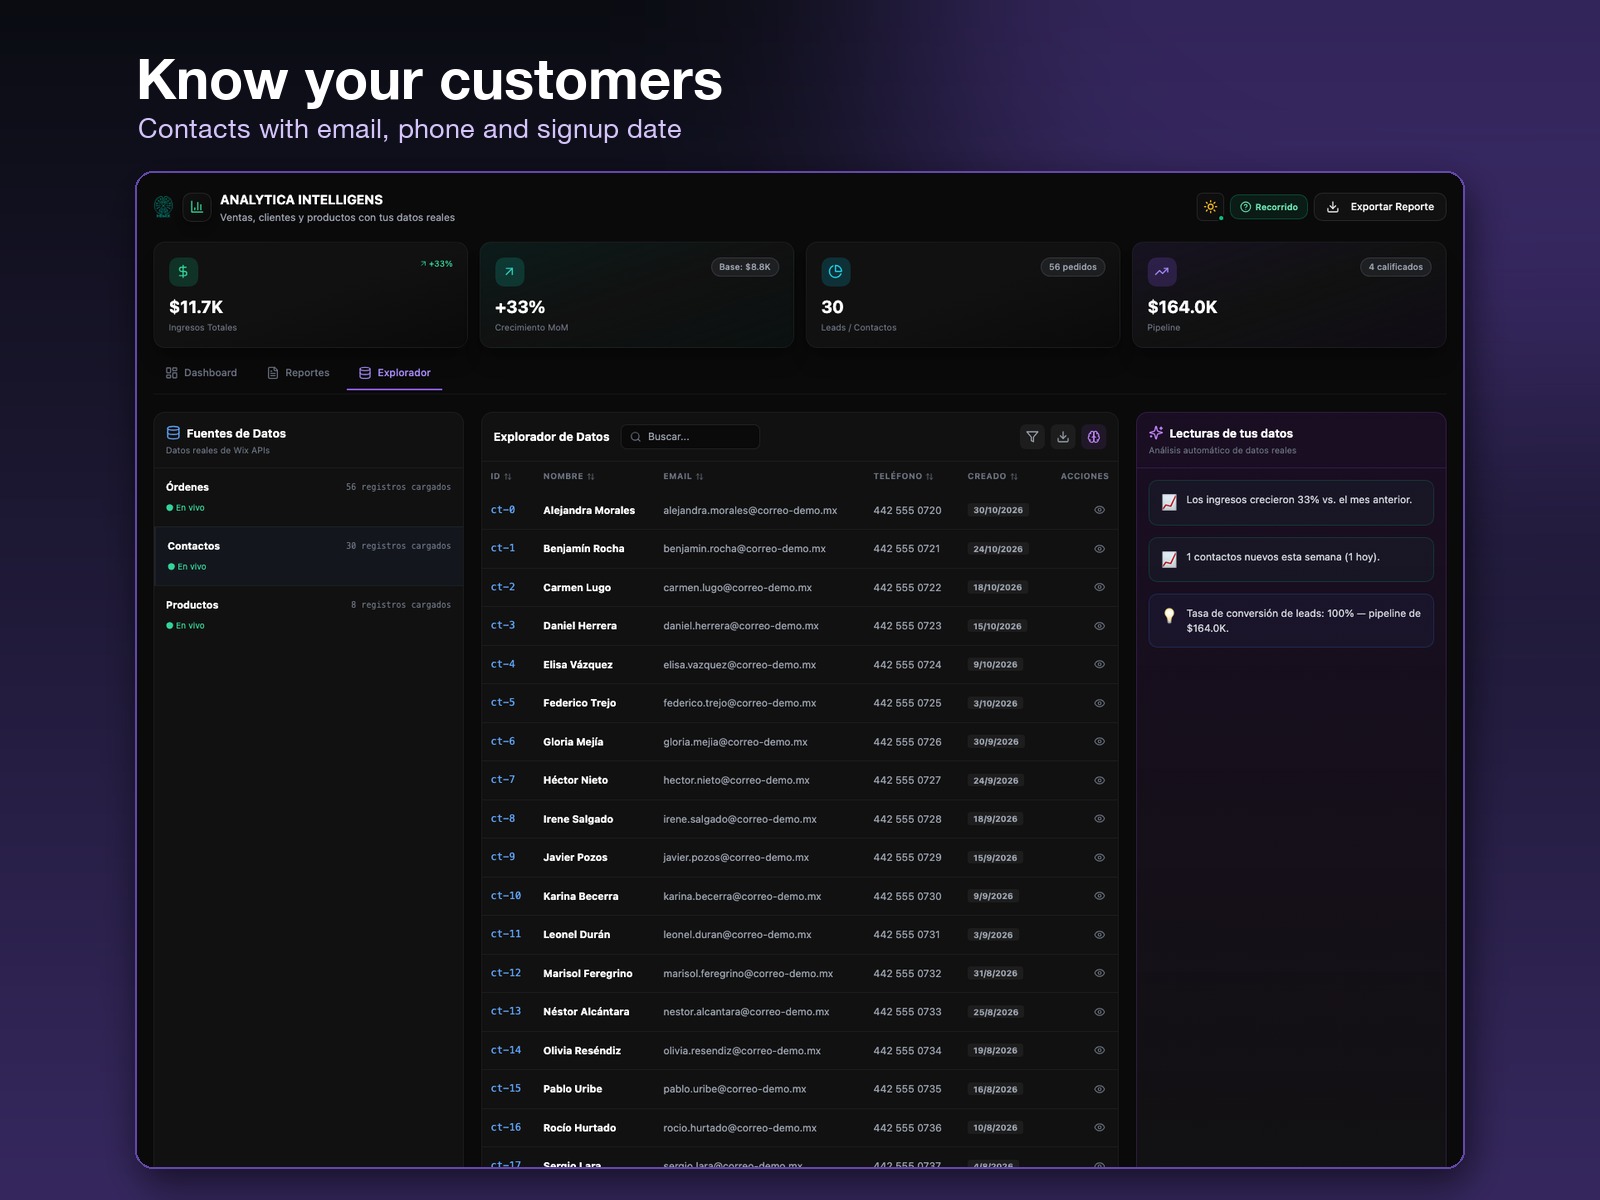
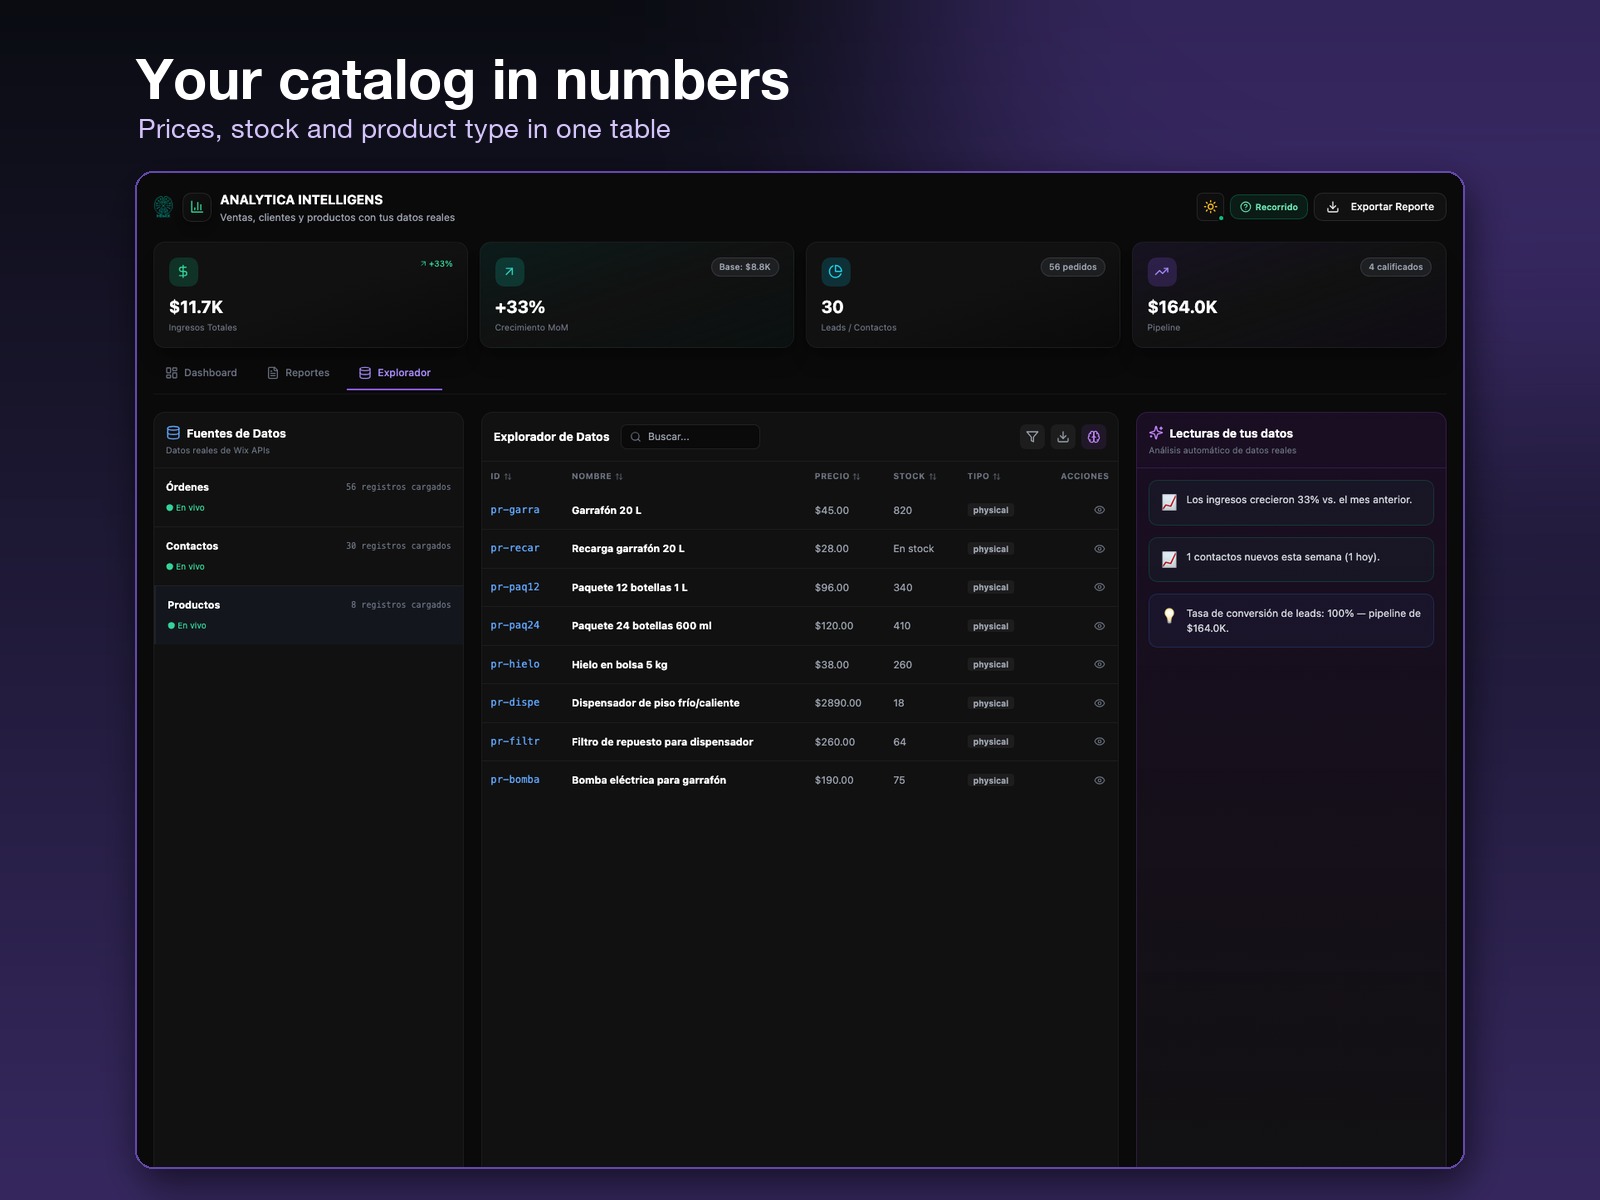
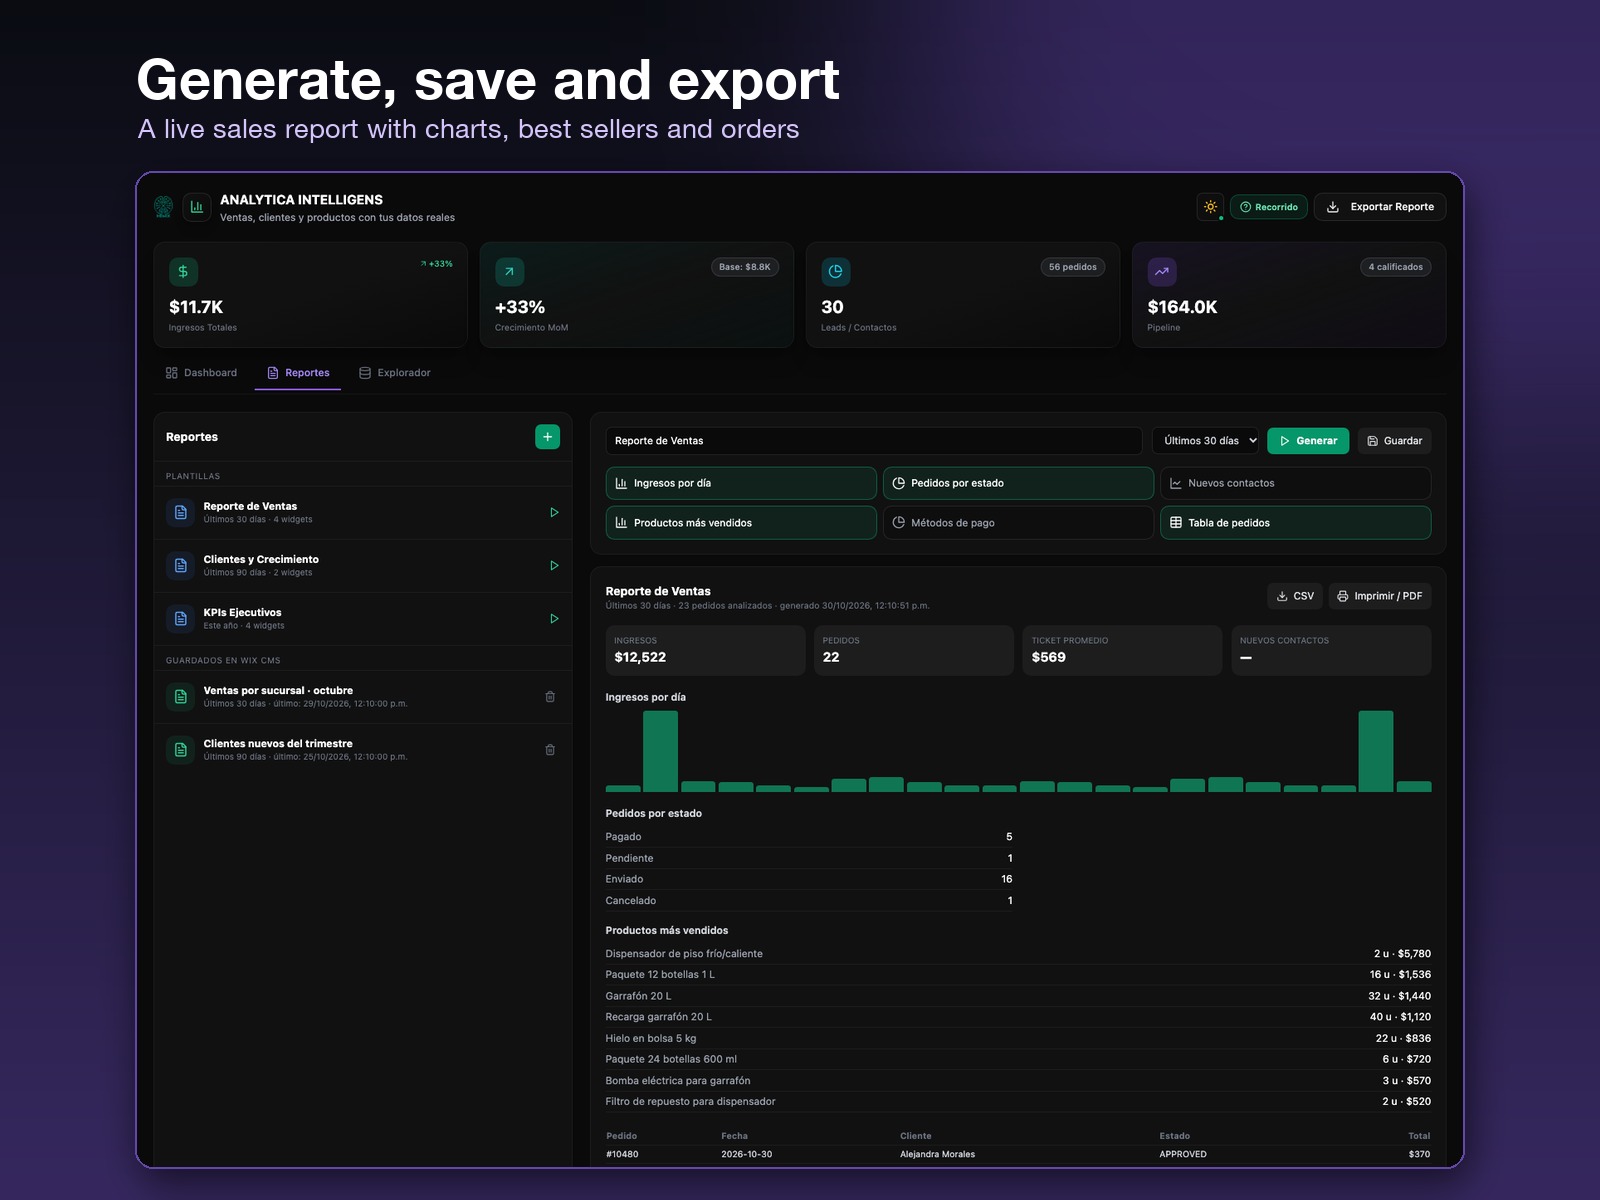
Analytica Business Analytics uygulamasına genel bakış
- Revenue, growth and pipeline from your own data
- Best-selling products by units and revenue
- Reports you save, re-run and export to CSV
- Explore your orders, contacts and products
Değerlendirme ve yorumlar
Bu uygulama henüz değerlendirme almamış. İlk değerlendiren siz olun.Fiyatlandırma ve ücretli abonelikler
Bu uygulama 14 günlük ücretsiz deneme sunarStarter Paketi
$
29
00
/ay
Dashboard, reports and explorer
Saved reports and CSV export
Up to 3 dashboard users
Pro Paketi
$
58
00
/ay
Everything in Starter
Up to 10 dashboard users
For growing teams
Enterprise Paketi
$
145
00
/ay
Everything in Pro
Unlimited dashboard users
For businesses with several branches
* Fiyat USD cinsindendir.